


What Are Google Analytics Mistakes?
Google Analytics is a powerful tool, but only when used correctly. Most marketers rely on it to understand user behavior, measure campaign performance, and guide business decisions. But even minor setup issues, like a misconfigured goal or a broken tracking tag, can quietly skew your data.
These mistakes are often subtle. You may still see numbers in your reports, but they’re not telling the whole story. Instead of clear insights, you’re working with incomplete, inflated, or misleading data. And if your marketing decisions are based on that data, your strategy may be off course without you even realizing it.
That’s why it’s important to know where things commonly go wrong and how to spot the warning signs.
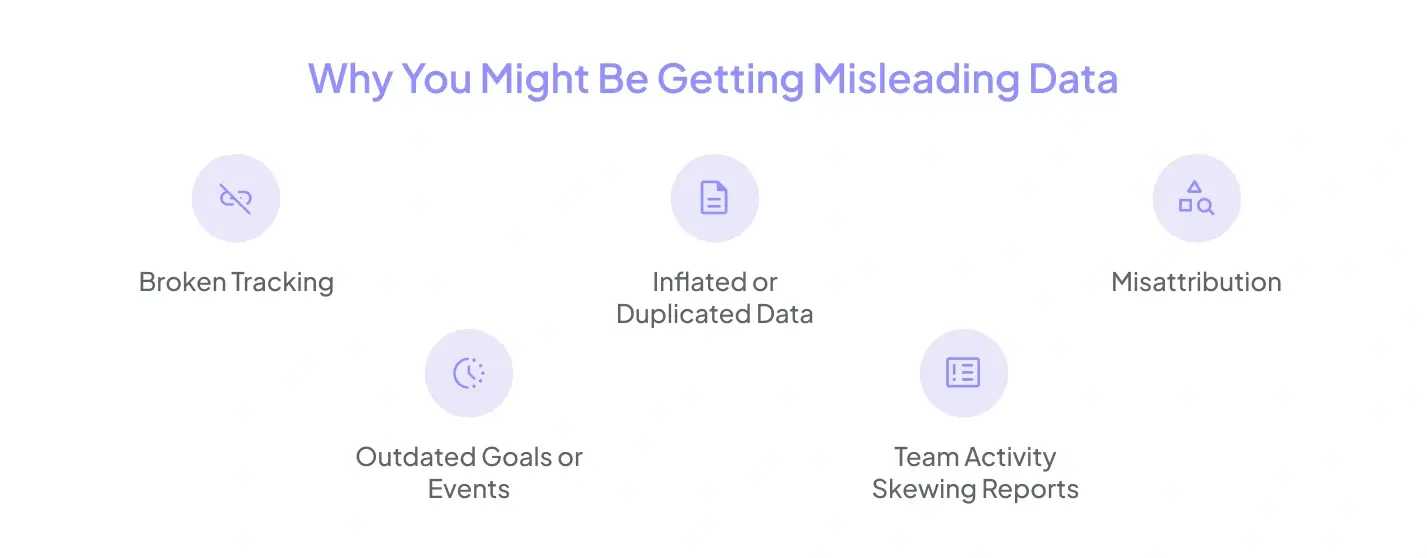
Why You Might Be Getting Misleading Data
Most businesses don’t intentionally mess up their analytics. It usually starts with a rushed setup, limited documentation, or a “set it and forget it” mindset. As the business grows, new pages get added, campaigns evolve, and platforms like GA4 or Google Ads change how they handle tracking. If your analytics setup doesn’t keep up, the gap between what’s happening on your site and what’s getting reported starts to widen.
Here’s how that plays out in your day-to-day marketing:
1. Broken Tracking
Let’s say you’re running a lead generation campaign and tracking form submissions. If the event stops firing after a landing page update, you could miss out on all those key events without realizing it.
2. Inflated or Duplicated Data
If multiple versions of the same tag are firing, like pageviews or purchases, your reports will show inflated results. This makes it hard to judge actual performance or compare across channels.
3. Misattribution
Your social campaigns may be working, but your UTM parameters are inconsistent. GA could miscategorize traffic as “direct” or lump all campaigns together under “other,” hiding what’s really driving results.
4. Outdated Goals or Events
As your business changes, the KPIs you care about shift too. If your GA goals still track an old thank-you page or a product that no longer exists, your data won’t reflect what matters now.
5. Team Activity Skewing Reports
Internal traffic, your marketing team, developers, and QA testers, can distort behavior metrics if not filtered out. Because of all the test visits, pages may look more engaging than they are.
These issues may seem minor. But together, they paint a picture that’s far from accurate. And if your marketing strategy depends on this data, you're making decisions in the dark.
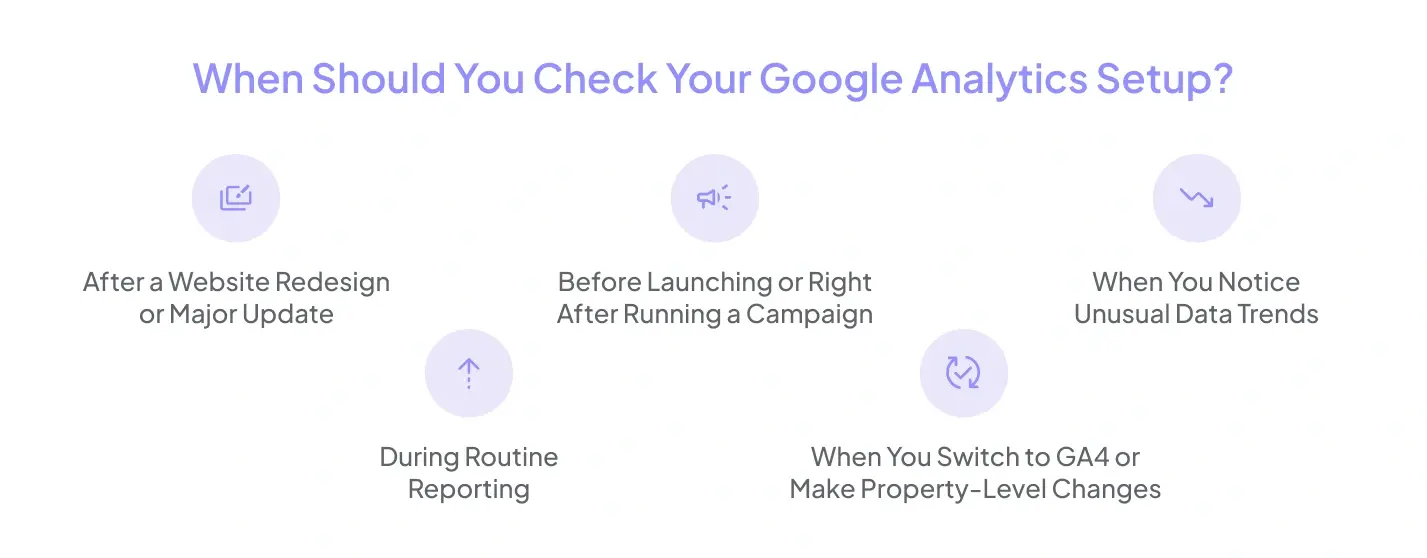
When Should You Check Your Google Analytics Setup?
Analytics errors aren’t always obvious. Your dashboards may look active, and reports continue to populate, but that doesn’t guarantee everything’s working as it should. That’s why it’s important to know when it’s time to check under the hood.
Here are some key situations when reviewing your Google Analytics setup is not just helpful, but necessary:
1. After a Website Redesign or Major Update
Even small layout changes can break event tracking or remove tags. If the thank-you page URL changes or a new element is introduced, your existing goals may stop working.
2. Before Launching or Right After Running a Campaign
Campaign performance depends on clean tracking. If UTMs are off or goals aren’t firing, you’ll be flying blind when evaluating success.
3. When You Notice Unusual Data Trends
A sudden spike in traffic? A drop in key events? Pages with zero views, even though they were promoted heavily? These anomalies are a sign to dig deeper.
4. During Routine Reporting
Whether you do monthly or quarterly reporting, it's smart to include a quick analytics check in your workflow to ensure that your present reflects reality.
5. When You Switch to GA4 or Make Property-Level Changes
GA4 doesn’t work the same way as Universal Analytics. If you’ve recently migrated, there’s a good chance some goals, events, or reports need reconfiguration.
The best time to catch analytics issues is before they impact decision-making. A simple review doesn’t take long, but skipping it can cost you months of misleading data.
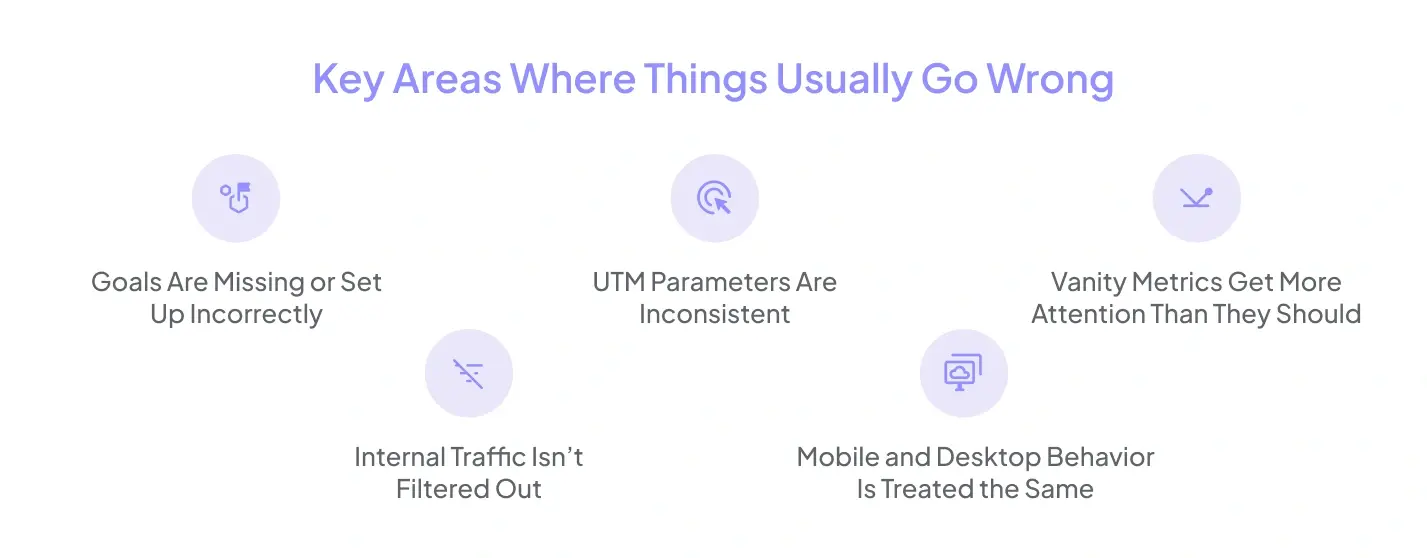
Key Areas Where Things Usually Go Wrong
Most Google Analytics setups fall apart in the same few places. Whether you're a startup setting up GA for the first time or a large team with multiple campaigns, the same patterns tend to emerge.
Below are the five areas where mistakes happen most often:
1. Goals Are Missing or Set Up Incorrectly
Sometimes, goals are never created. Other times, they’re left behind after a website change, still active, but no longer practical or functional. If you’re only tracking pageviews, you’re missing out on what really matters.
2. UTM Parameters Are Inconsistent
Campaign tagging can quickly get messy. If your team uses different terms or formats across ads, emails, or social media, your reports won’t group them correctly. As a result, traffic from the same campaign might appear under multiple, disorganized labels.
3. Vanity Metrics Get More Attention Than They Should
Pageviews, bounce rate, and time on site are easy to track, but they don’t always show value. Many marketers focus too much on these numbers and ignore deeper signals like engagement or key events.
4. Internal Traffic Isn’t Filtered Out
If your own team visits the website regularly (which they do), that traffic affects your data. Pages may seem more popular or sticky than they actually are because of repeated internal testing and QA checks.
5. Mobile and Desktop Behavior Is Treated the Same
Users don’t behave the same way across devices. If you’re viewing everything in aggregate, you could miss signs that your mobile site underperforms, or that most key events happen on desktop.
Once you know where to look, these mistakes aren’t hard to fix. But if they go unnoticed, they can lead to months of data that looks solid but tells the wrong story.
Common Mistakes Found in Google Analytics
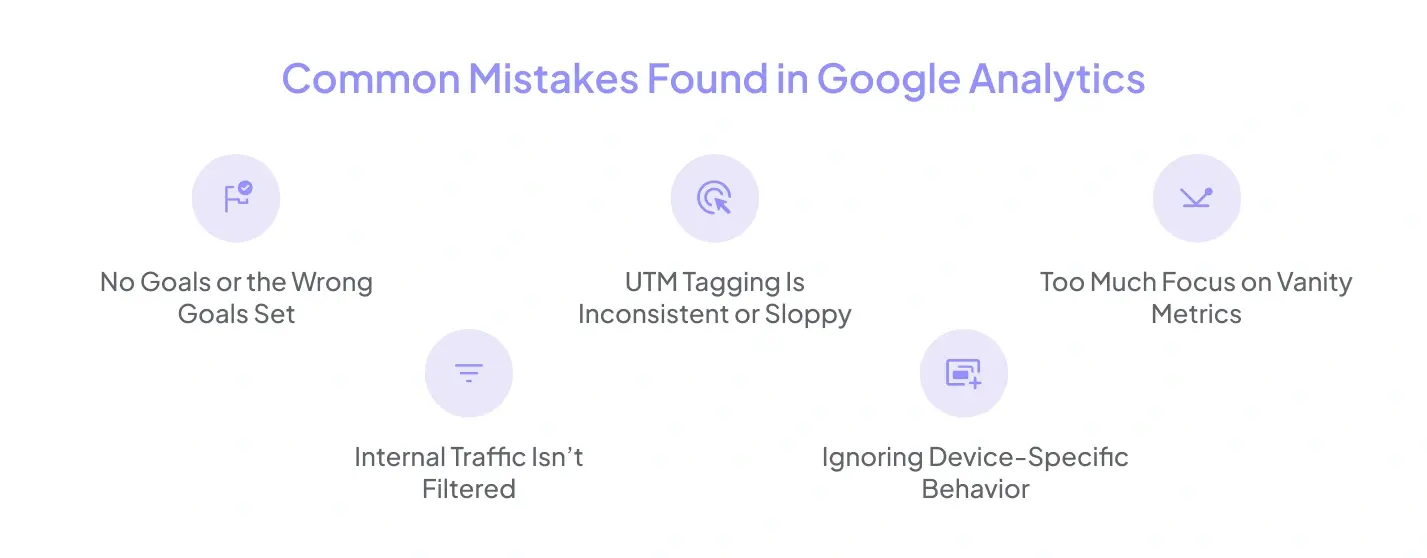
Let’s take a closer look at these five problem areas. These mistakes are common in audits, and each one can significantly impact the accuracy of your reports.
1. No Goals or the Wrong Goals Set
Goals tell Google Analytics what success looks like. Without them, you’re just collecting traffic data with no context.
A common mistake is tracking pageviews or sessions but not tying them to meaningful actions like form submissions, purchases, or downloads. Another issue is outdated goals, like thank-you page URLs that no longer exist, leading to zero completions even though users are converting.
What to check:
- Do your goals reflect your current marketing objectives?
- Are your destination or event conditions still accurate?
- Have any old or unused goals been removed?
Without well-defined goals, you can’t measure performance in a way that helps guide decision-making.
2. UTM Tagging Is Inconsistent or Sloppy
UTM parameters are used to track the source of traffic to your website. But you’ll have a messy, unreliable dataset if they're not used consistently.
You might see the same campaign show up under multiple source/medium combinations just because someone capitalized “Facebook” in one link and wrote “Facebook” in another. GA treats these as separate entries.
Common issues:
- Using different formats (e.g., “email,” “Email,” “e-mail”)
- Forgetting to tag important links (like buttons in newsletters)
- Repeating campaign names or using vague terms like “test”
Fix it by:
- Creating a UTM naming convention
- Using Google’s Campaign URL Builder
- Keeping a shared doc or spreadsheet for all live campaigns
Clean tagging makes it easier to analyze performance across channels and campaigns.
3. Too Much Focus on Vanity Metrics
Pageviews and bounce rate might look good on reports, but they don’t always reflect meaningful engagement. A blog post can have thousands of views, but if no one clicks your CTA or fills out a form, what’s the real value?
These “vanity metrics” often lead marketers to chase traffic volume instead of key events or outcomes.
What to track instead:
- Event completions (e.g., video plays, downloads, button clicks)
- Scroll depth or time spent on key sections
- Goal key events tied to business value (leads, signups, purchases)
Always connect your metrics back to business impact.
4. Internal Traffic Isn’t Filtered
Your team visits the site frequently. Developers, marketers, and QA testers all click around, test forms, and reload pages.
Your data will be skewed if you don’t filter that traffic out. Your bounce rate may drop, time on page may look longer, and traffic sources may become muddied.
How to fix it:
- Use IP filters to exclude known office or remote team IPs
- Set up internal audiences in GA4 and exclude them from reports
- Use a separate GA property for staging or pre-production environments
This minor adjustment can make your metrics significantly more reliable.
5. Ignoring Device-Specific Behavior
Mobile and desktop users interact with your site differently. A page that performs well on desktop might have a poor mobile experience, tiny buttons, slow load times, or awkward layouts.
If you only look at aggregate metrics, you’ll miss these patterns.
Why it matters:
- Mobile users may visit, but not convert, due to friction
- Desktop may show higher time on page or better form completion
- Optimizing for one device type doesn’t automatically improve performance on the other
What to do:
- Always break down traffic and key events by device
- Use GA4 Explorations to compare mobile vs. desktop behavior
- Run regular mobile usability tests to catch layout issues
Segmenting by device gives you a clearer view of where to optimize next.
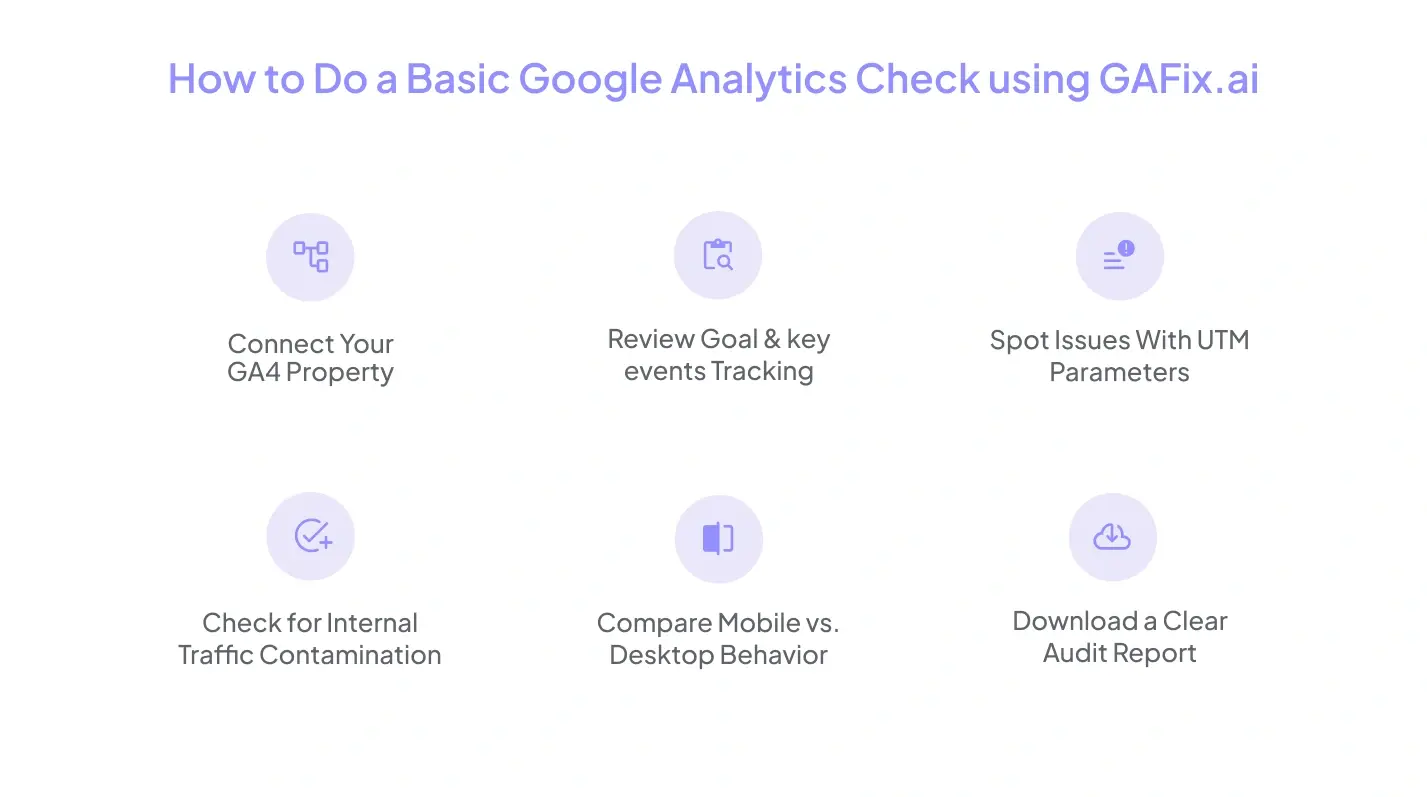
How to Do a Basic Google Analytics Check using GAfix.ai
How to Do a Basic Google Analytics Check using GAfix.ai
You don’t need to be a data analyst or spend hours digging through GA reports to spot issues. A basic Google Analytics check can highlight the most common setup problems, especially when using a tool like GAfix.ai, simplifying the process.
GAfix.ai was built specifically to help marketers catch mistakes in their GA, GTM, and ad tracking setups. It removes the guesswork and gives you a clear, structured audit in minutes.
Here’s how you can use GAfix.ai to run a quick but thorough check:
1. Connect Your GA4 Property
Once you sign in, GAfix will prompt you to connect your Google Analytics account securely. After that, it automatically scans your GA4 setup across key areas, goals, events, traffic sources, and more.
You don’t need to dig through reports or settings manually. GAfix does the heavy lifting for you.
2. Review Goal & key events Tracking
The platform checks whether:
- Your goals are active and firing correctly
- Important key events (like form submissions or checkouts) are being recorded
- Any goals are duplicated or misconfigured
If something’s off, GAfix flags it clearly and explains how to fix it.
3. Spot Issues With UTM Parameters
GAfix Fix audits your campaign tracking by examining the consistency and accuracy of UTM tags. If there are duplicates, missing fields, or mixed naming conventions (like “LinkedIn” vs. “LinkedIn”), it alerts you and shows how they affect attribution in GA4.
This is especially helpful if you run multiple campaigns across email, paid search, and social.
4. Check for Internal Traffic Contamination
If your reports include many visits from your own team or agency, GAfix highlights that as a red flag. It can detect signs of inflated engagement or session duration caused by internal users.
You’ll get suggestions like setting up IP filters or excluding internal audiences in GA4.
5. Compare Mobile vs. Desktop Behavior
Instead of manually slicing data in GA4, GAfix gives you side-by-side comparisons of:
- Bounce rate
- Time on site
- Key events rate by device
This helps you quickly identify whether one device segment is underperforming and whether it’s worth optimizing further.
6. Download a Clear Audit Report
Once your check is complete, GAfix.ai gives you a downloadable audit summary. It includes:
- A breakdown of what’s working and what’s not
- Explanations of how each issue affects your marketing
- Actionable next steps for your team or developer
This makes it easy to share insights with stakeholders or take immediate action.
Running a check with GAfix takes just a few minutes, but it gives you insights that could save months of misinformed decisions. Whether you're preparing for a big campaign or just doing a monthly review, it’s a fast way to ensure your GA setup works the way it should.
Conclusion
Even small analytics mistakes can throw off your reports and cost you good decisions. Reviewing your setup, especially with a tool like GAfix.ai, helps you catch issues early, clean up your data, and stay confident in your measurements. Before your next campaign or report, give your tracking a quick health check. It’s worth it.

Frequently Asked Questions
How do I know if my Google Analytics setup is working correctly?

Start by checking if your key pages and actions (like form submissions, button clicks, or product views) are being tracked in GA4. You can also use tools like GAfix.ai to run a quick audit and spot issues like missing events, duplicate tags, or misconfigured goals.
Can small tracking errors really affect my marketing performance?
Yes. Minor issues, like a broken goal or a missing UTM parameter, can lead to inaccurate data. Over time, this affects budget decisions, optimization strategies, and campaign success measurement.
How often should I review or audit my GA4 setup?
A basic analytics check should be done at least once every quarter, or anytime there’s a major change to your website, campaigns, or tracking strategy. Regular reviews help catch problems before they impact your reports or ROI.
Confident Decisions Start with Accurate Tracking
Ensure your GA4 and GTM are correctly configured, reliable, and ready for scale.


Subscribe To Our Newsletter


