


Google Analytics 4 (GA4) is the latest version of Google’s analytics platform, designed to provide deeper insights into user behavior across websites and apps. While it offers more advanced tracking and reporting than Universal Analytics, many businesses find it confusing, especially those without a dedicated data team. The interface is different, metrics are renamed or redefined, and reports are structured around events rather than pageviews.
For small and medium teams, this shift can make GA4 feel overwhelming. It’s easy to get lost in engagement metrics, conversions, or retention reports without understanding how they connect to actual business outcomes. This gap often leads teams to ignore GA4 data, rely on intuition, or spend excessive time manually analyzing spreadsheets.
Despite these challenges, understanding GA4 is essential. Even non-technical teams can make informed decisions about marketing, product design, or website improvements if they know what reports to focus on and how to interpret the numbers. Later in this blog, we’ll explore practical approaches to reading GA4 reports without a data team and introduce tools like GAfix that simplify the process.
What GA4 Reports Actually Tell You?
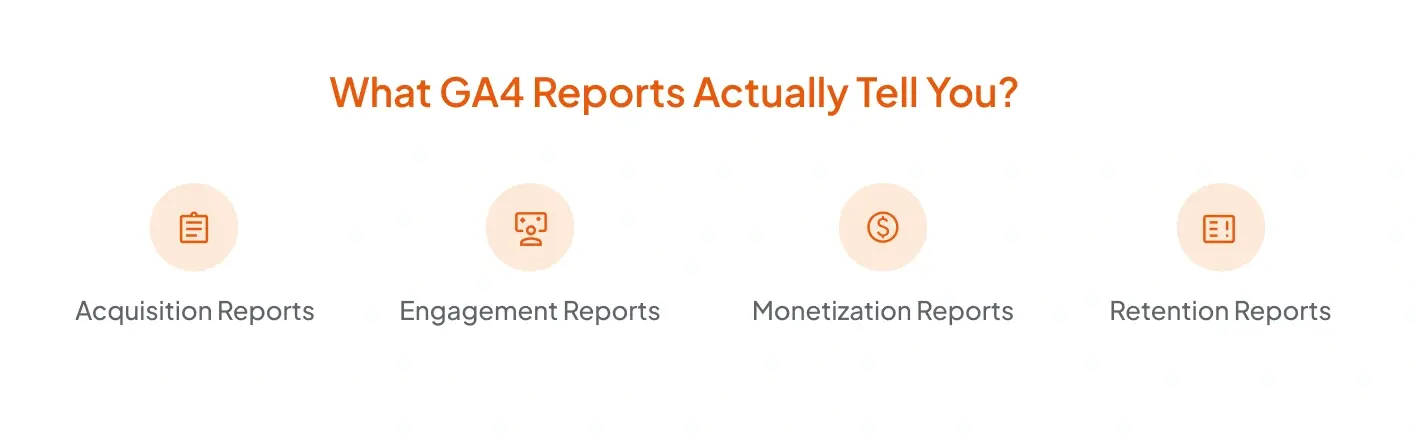
GA4 organizes data differently from Universal Analytics, which can be confusing at first. Instead of focusing on pageviews, GA4 emphasizes events and user interactions. Understanding the main report categories helps businesses see the story behind their data.
1. Acquisition Reports
These reports show where your users are coming from: organic search, paid ads, social media, or direct visits. GA4 includes both “User acquisition” (based on the first user's source/medium) and “Traffic acquisition” (based on the session's source/medium). For example, a high number of users from social campaigns indicates your marketing efforts are practical, while low engagement might signal a need to optimize your content.
2. Engagement Reports
Engagement metrics reveal how users interact with your site or app. Metrics such as engagement rate, average engagement time, and events triggered indicate whether visitors find your content useful and relevant. An “engaged session” in GA4 is defined as a session lasting longer than 10 seconds, having at least one conversion event, or having at least two page views or screen views. Even without a data team, these numbers can highlight which pages or features are performing well.
3. Monetization Reports
For businesses tracking revenue, monetization reports provide insights into purchases, in-app transactions, and e-commerce behavior. These reports rely on proper eCommerce or in-app event implementation (e.g., purchase, add_to_cart, begin_checkout) in Google Analytics 4 (GA4). Understanding which products or services drive revenue helps teams make better marketing and inventory decisions.
4. Retention Reports
Retention reports track the percentage of users returning over time (e.g., Day 1, Day 7, Day 30) rather than the frequency of visits. High retention suggests strong user satisfaction, while low retention might indicate issues with content, product experience, or onboarding.
While GA4 offers detailed insights, interpreting them correctly can be challenging. Even simple reports can produce overwhelming data for teams without analysts. Tools like GAfix help bridge this gap by auditing GA4 setups, highlighting anomalies, and providing recommendations for reports that matter most to your business.
How to Interpret GA4 Metrics Without a Data Team?

GA4 provides many metrics, but not all are immediately meaningful for business decisions. Understanding the core metrics helps teams focus on actionable insights without needing an analyst.
1. Users and New Users
- Users metric represents active users — those who have an engaged session, not total unique visitors.
- New Users are first-time visitors. Tracking these numbers shows how well your marketing channels are attracting audiences.
2. Sessions and Engagement
- Sessions count interactions within a specific time frame.
- Engagement rate measures how actively users interact with your content, including clicks, scrolls, or video plays. High engagement signals that your content resonates with visitors.
- Engagement rate = Engaged sessions ÷ total sessions, where an engaged session lasts >10 seconds, includes ≥1 conversion, or ≥2 pageviews/screens.
3. Conversions and Events
- Conversions track actions that matter, like form submissions, purchases, or sign-ups. In GA4, you must manually mark specific events as “Conversions.”
- Events capture specific interactions, such as downloads or button clicks. Prioritizing events tied to business goals prevents getting lost in irrelevant data.
4. Average Engagement Time
- This metric shows the average duration users spend interacting with your content. A longer engagement often indicates a better user experience or more relevant content.
5. Traffic Sources
- Knowing where your traffic comes from, whether organic, paid, referral, or direct, helps you evaluate your marketing performance. GA4 uses dimensions like source, medium, and campaign to define traffic sources. It also informs which channels to invest in or optimize.
Interpreting GA4 metrics becomes simpler with tools that highlight irregularities or potential issues. For instance, GAfix can audit your GA4 setup and flag anomalies in metrics like engagement, conversions, or traffic sources. This makes it easier for non-technical teams to focus on insights that actually impact business decisions rather than sifting through raw data.
Simplifying GA4 Dashboards for Quick Insights

GA4 dashboards can be customized to show only the most relevant metrics, making it easier for teams to monitor performance without getting overwhelmed. Focusing on key data points helps you quickly understand user behavior and make informed decisions.
1. Create a Custom Overview Dashboard
- Include metrics like users, engagement rate, conversions, and traffic sources.
- This provides a snapshot of your website or app performance in one place.
2. Use Comparisons to Spot Trends
- Compare metrics over time (daily, weekly, or monthly) to identify patterns.
- For example, a sudden drop in engagement could highlight a technical issue or ineffective content.
3. Filter for Relevant Segments
- In GA4, use “Comparisons” or “Filters” in standard reports and “Segments” in Explorations.
- Segmenting your audience helps pinpoint what drives conversions or where improvements are needed.
4. Focus on Actionable Metrics
- Avoid overloading dashboards with every available metric.
- Prioritize metrics that align with business objectives, like conversion rate for e-commerce or sign-ups for SaaS.
5. Save and Share Views
- These are typically shared as custom reports or Explorations.
- Regularly reviewing the same view ensures consistency in tracking performance and making data-driven decisions.
A well-organized dashboard turns raw GA4 data into quick, actionable insights for teams without a dedicated analyst. It helps businesses track performance trends, identify issues early, and allocate resources efficiently.
Using GAfix to Audit and Interpret GA4 Reports
GAfix is an automated GA4 audit tool designed to help businesses identify and resolve tracking issues, ensuring accurate and reliable data for informed decision-making.
Key Features of GAfix
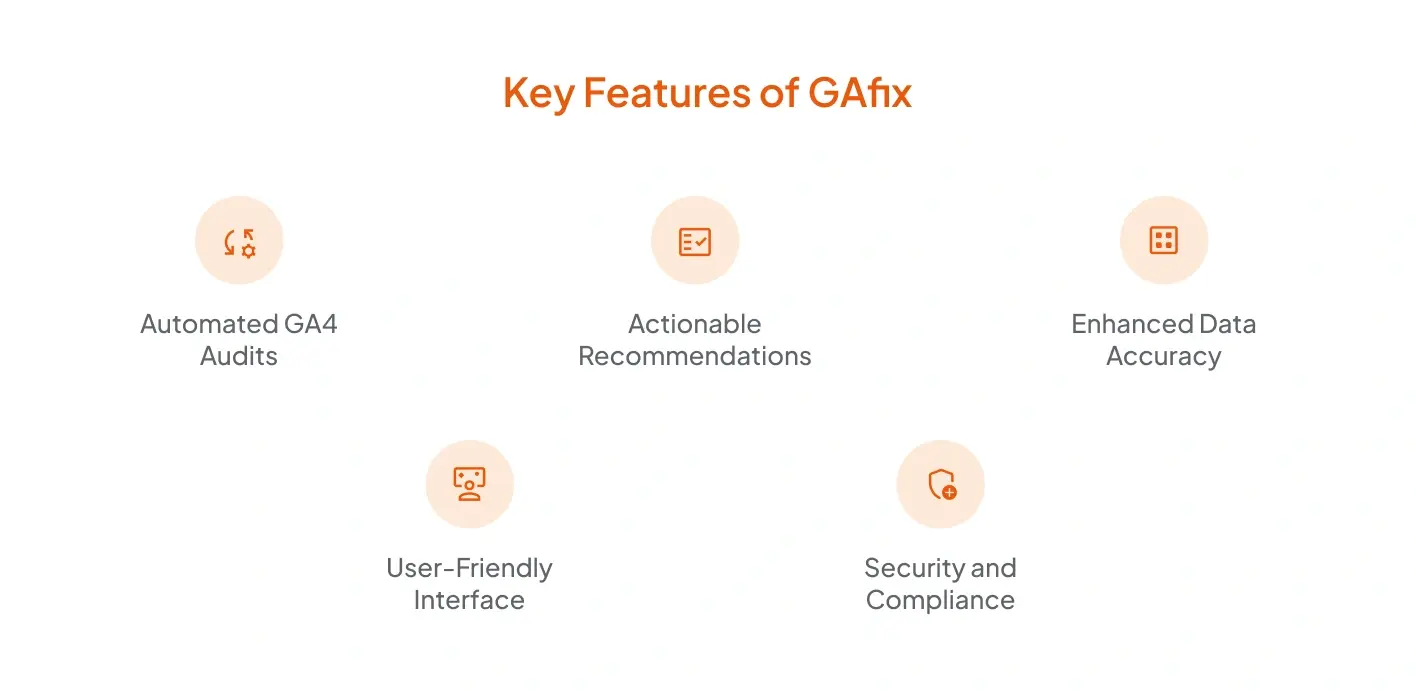
- Automated GA4 Audits: GAfix automatically scans your GA4 setup to detect common misconfigurations, such as missing events, incorrect tracking, and data discrepancies. This automation saves time and reduces the risk of human error.
- Actionable Recommendations: After completing the audit, GAfix provides clear and actionable recommendations to address the identified issues. These suggestions are designed to be easy to implement, even for teams without a dedicated data analyst.
- Enhanced Data Accuracy: By identifying and fixing tracking issues, GAfix helps improve the accuracy of your GA4 data. This leads to more reliable insights, enabling better decision-making across marketing, product, and business strategies.
- User-Friendly Interface: GAfix offers an intuitive interface that simplifies the audit process. Users can quickly connect their GA4 account, initiate an audit, and review results without needing technical expertise.
- Security and Compliance: GAfix prioritizes data security and privacy. It operates with read-only access to your GA4 account, ensuring no changes are made to your data or settings. Additionally, GAfix adheres to strict security standards to protect your analytics information.
How GAfix Benefits Non-Technical Teams?
- Time Efficiency: Automates the auditing process, reducing the time spent on manual checks.
- Cost-Effective: Provides a comprehensive audit without the need for hiring external consultants or dedicating internal resources.
- Improved Data Quality: Ensures that your GA4 data is accurate and reliable, leading to more effective marketing and business decisions.
- Ease of Use: Designed for users without a technical background, making GA4 audits accessible to all team members.
Getting Started with GAfix
- Connect Your GA4 Account: Securely sign in and link your Google Analytics property to GAfix.
- Initiate the Audit: Choose your account and start the audit process. GAfix will scan your setup for potential issues.
- Review the Report: Once the audit is complete, GAfix provides a detailed report that outlines the identified issues and recommended fixes.
- Implement Recommendations: Follow the provided guidance to address the issues and optimize your Google Analytics 4 (GA4) setup.
By leveraging GAfix, businesses can ensure their GA4 setup is optimized for accurate data collection, leading to more informed decision-making and improved business outcomes.
Practical Tips for Teams Without Analysts
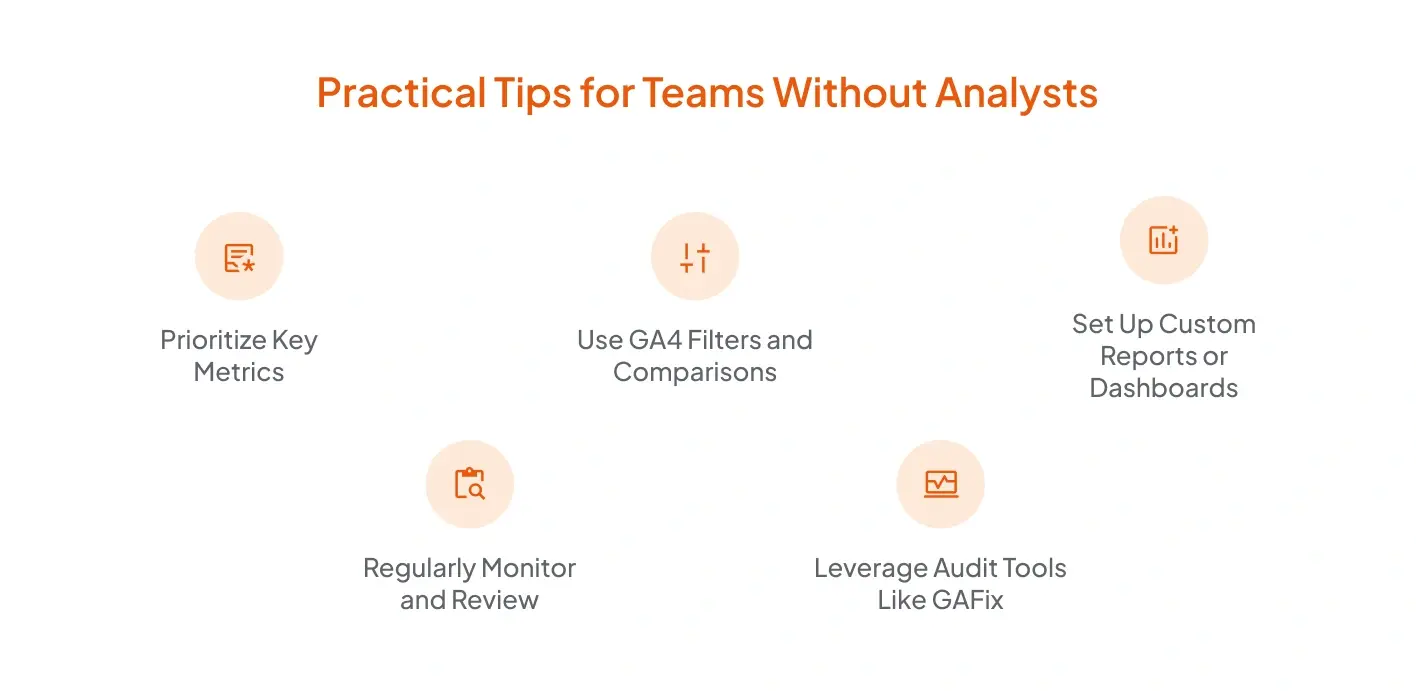
Understanding GA4 data doesn’t have to be overwhelming, even if your team doesn’t have a dedicated analyst on board. By focusing on a few key practices, businesses can gain actionable insights and make better decisions.
1. Prioritize Key Metrics
Focus on the metrics that directly impact your business goals, such as:
- Conversions (purchases, sign-ups, downloads)
- Engagement rate
- User retention
- Traffic sources
Avoid getting distracted by every available metric. Concentrating on what matters ensures your analysis is efficient and effective.
2. Use GA4 Filters and Comparisons
Use Filters or Comparisons in GA4 Reports, or Segments in Explorations, to analyze users by device, location, or behavior.
3. Set Up Custom Reports or Dashboards
Even basic dashboards can save time. Create custom reports via the Reports Library or Explorations tab to save your key views.
4. Regularly Monitor and Review
Schedule regular reviews of your GA4 data, even if it’s just once a week. Observing trends over time helps catch potential issues early and highlights areas for improvement.
5. Leverage Audit Tools Like GAfix.ai
While these practices simplify GA4 reporting, tools like GAfix.ai can further help by auditing your setup and highlighting inconsistencies. This ensures that the metrics you rely on are accurate, reducing the risk of making decisions based on incomplete or incorrect data.
By combining these practices with occasional automated audits, teams without analysts can confidently interpret GA4 data and make informed decisions that drive growth.
Conclusion
GA4 offers valuable insights, but its complexity can challenge teams without dedicated analysts. By focusing on key metrics, setting up simple dashboards, and regularly reviewing data, businesses across industries can make informed decisions. Understanding user behavior and trends allows teams to optimize marketing, improve experiences, and drive growth without getting lost in overwhelming reports. For accurate results in regions affected by privacy laws (like GDPR), ensure that Consent Mode v2 is correctly implemented — this prevents underreporting caused by users rejecting cookies.

Frequently Asked Questions
Do I need advanced analytics skills to read GA4 reports?

No. GA4 reports are designed to be more visual and intuitive than before. You can use built-in reports, such as “Traffic Acquisition” or “Engagement Overview,” to understand key metrics, including user behavior, top sources, and conversions, without needing advanced analytics skills.
Which GA4 reports should small business owners focus on first?
Start with three main reports: Acquisition, to see where your users come from; Engagement, to understand what content performs best; and Monetization, to track sales or conversions.
How can I simplify GA4 data for team discussions?
Use Exploration reports to visualize data with charts or tables, then export insights into Google Looker Studio for easy sharing. This helps non-technical team members understand performance trends without diving into raw data.
Confident Decisions Start with Accurate Tracking
Ensure your GA4 and GTM are correctly configured, reliable, and ready for scale.


Subscribe To Our Newsletter


