Looker Studio · Analytics · ADs

One dashboard your team will actually open.

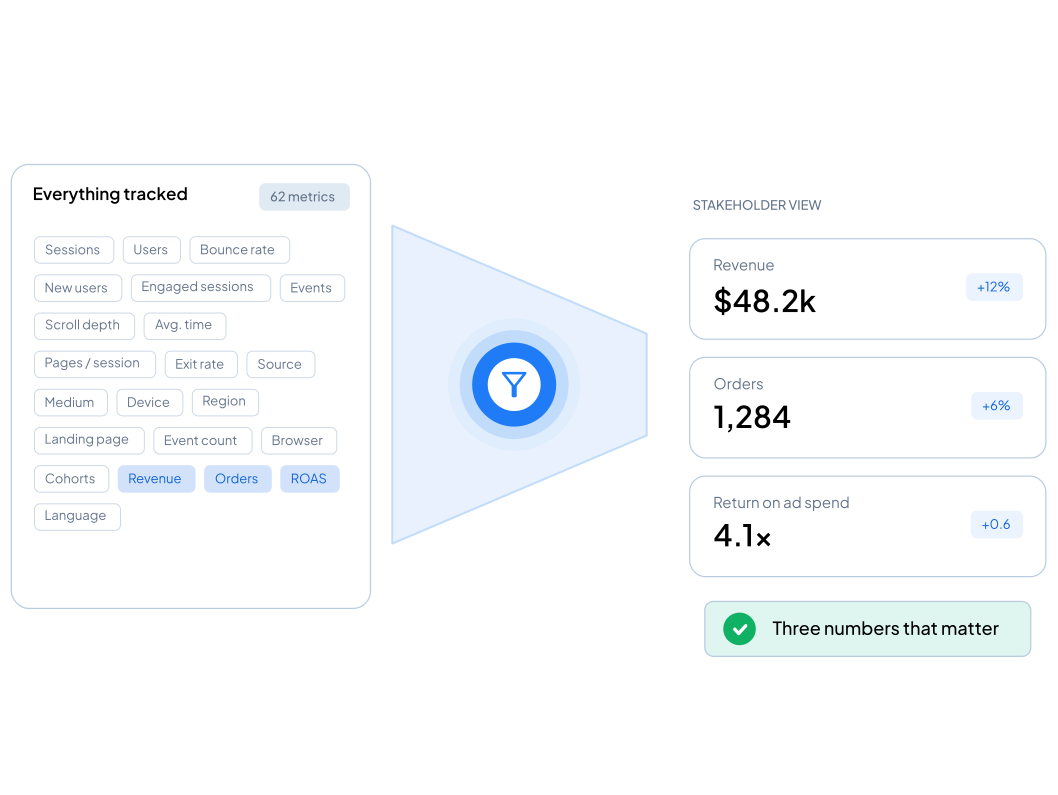
Default analytics reports are built for analysts. We build a Looker Studio dashboard around the handful of numbers your team makes decisions with, then hand you the keys.

Fixed price

No retainer

Full edit access at handover

Standard scope. Anything unusual is confirmed on the kickoff call.

The symptoms

When the reports exist but nobody uses them

The data is already there. Getting it out in a usable shape is the actual problem.

Your team can't find the numbers they need without help

Stakeholders want one weekly view, not an exploration tool

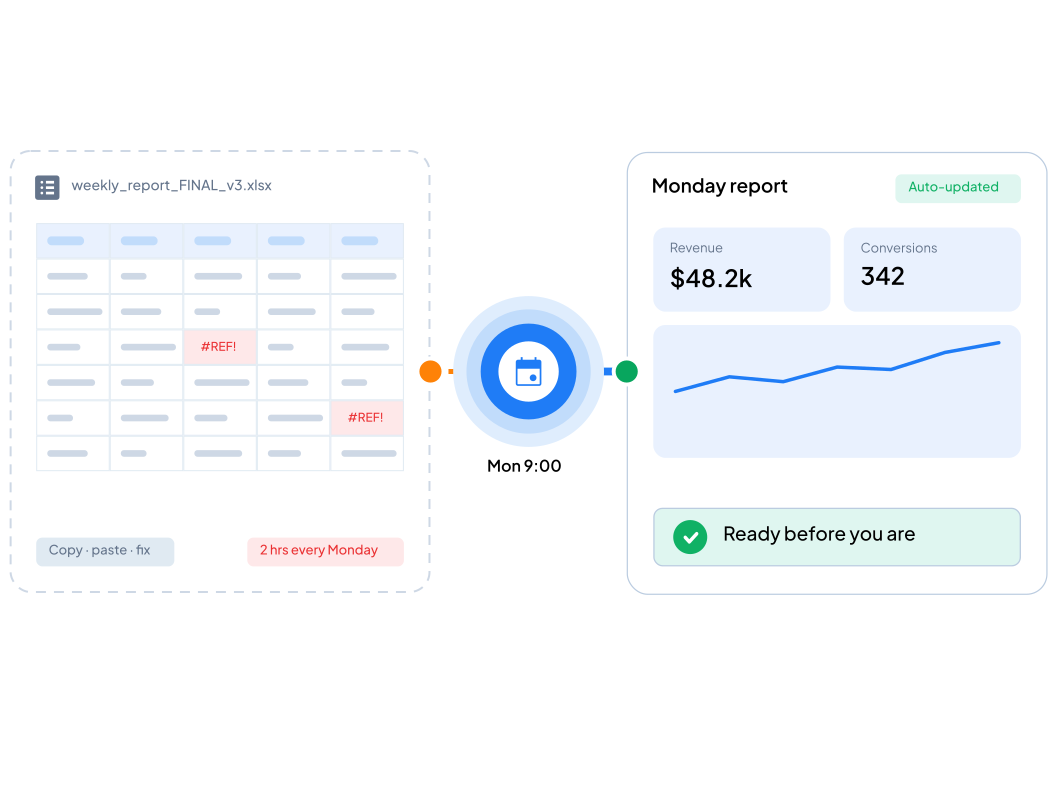
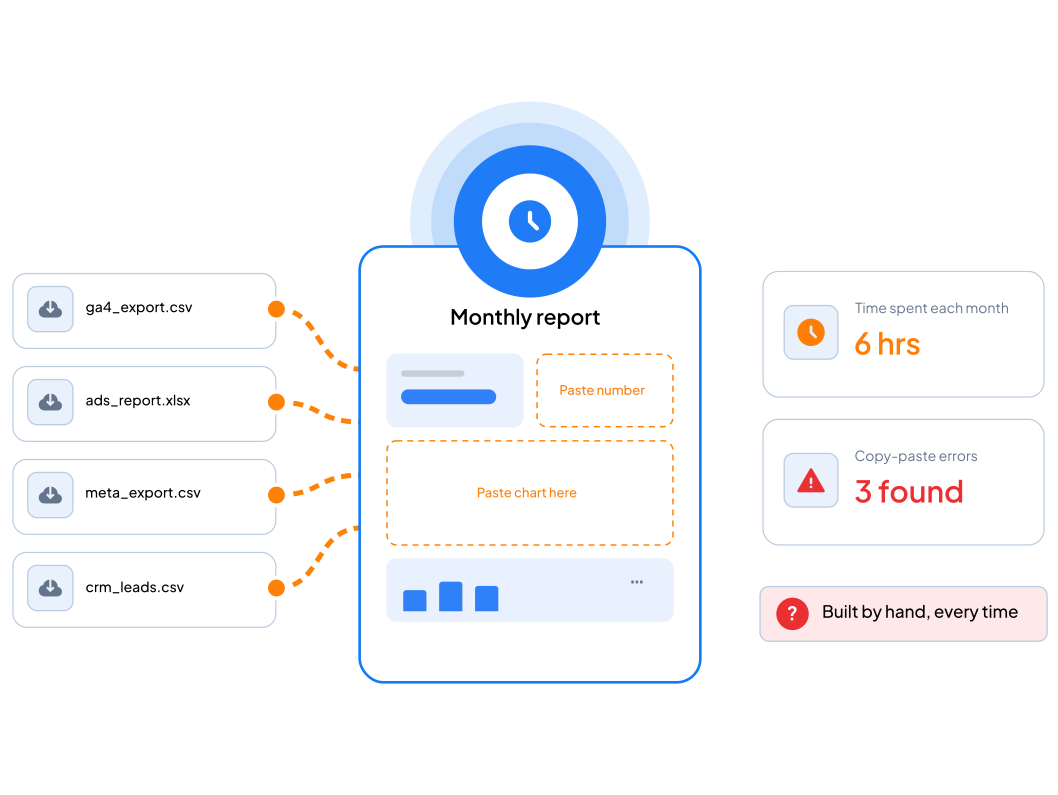
Someone rebuilds the same spreadsheet every Monday

The metrics that matter are scattered across five reports

The reporting was designed for a different kind of business

Bar chart comparing GA4 audit workflows, showing GAFix delivers 70% time savings versus other tools

What changes

Not a template. Built around your decisions.

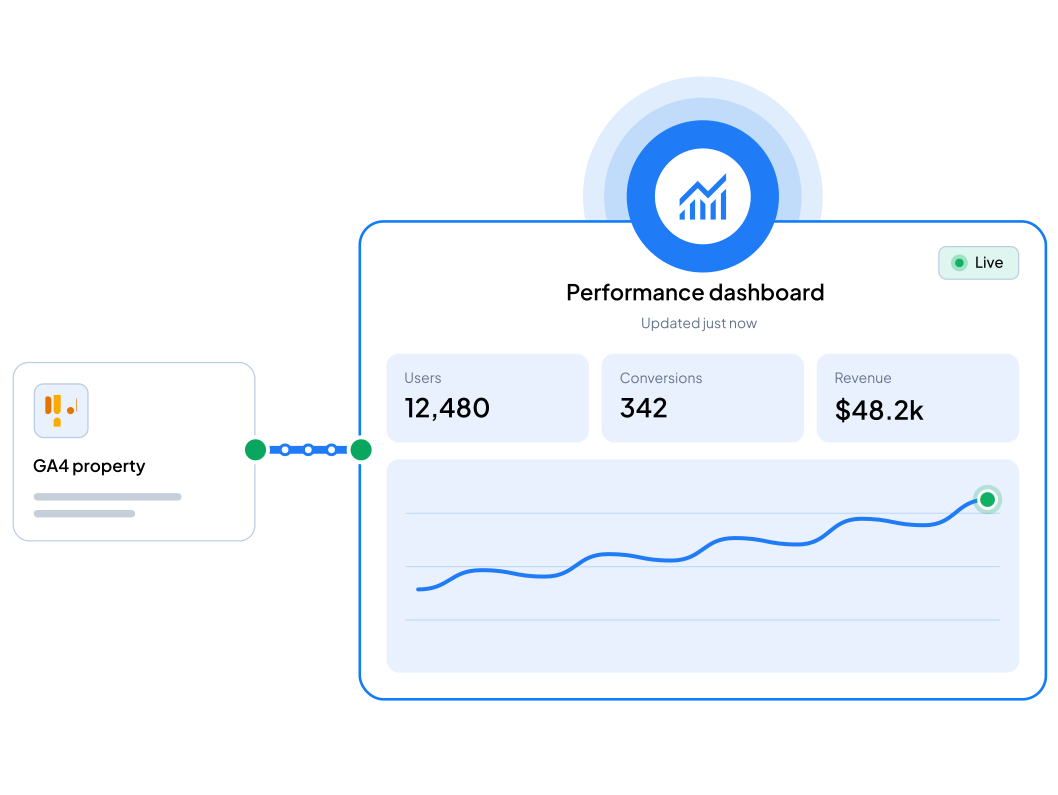
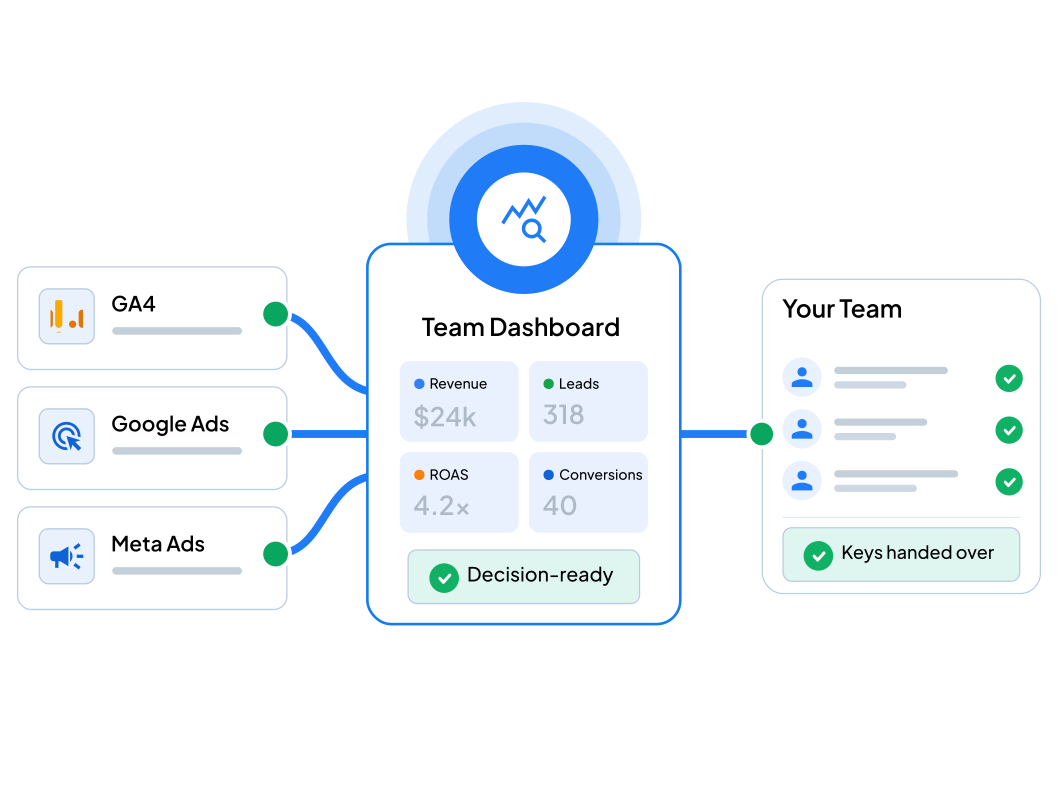
We connect Looker Studio to your analytics property and build around the metrics you act on, rather than the defaults every dashboard ships with.

Bar chart comparing GA4 audit workflows, showing GAFix delivers 70% time savings versus other tools

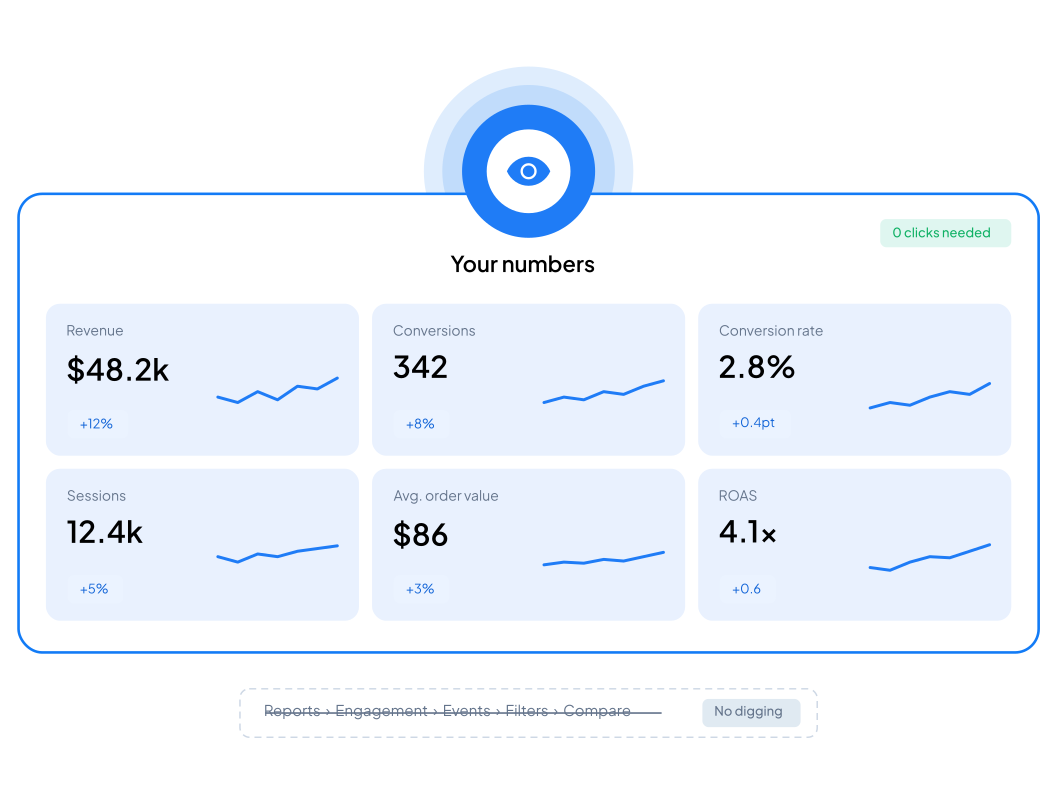
The conversions that matter to you, in the first screen

Date ranges, filters and segment comparisons that work

Traffic grouped by the channels you actually run

Funnel performance across the stages you track

Live and shareable, with no manual exporting

Scope

What's included

Data connection
Looker Studio connected to your analytics property
Dimensions and metrics configured deliberately
The build
Up to five pages covering your core reporting
Summary, acquisition, conversion performance and funnel
Calculated metrics
Conversion rate, cost per acquisition, revenue per session where data allows
Fields named the way your team already talks
Handover
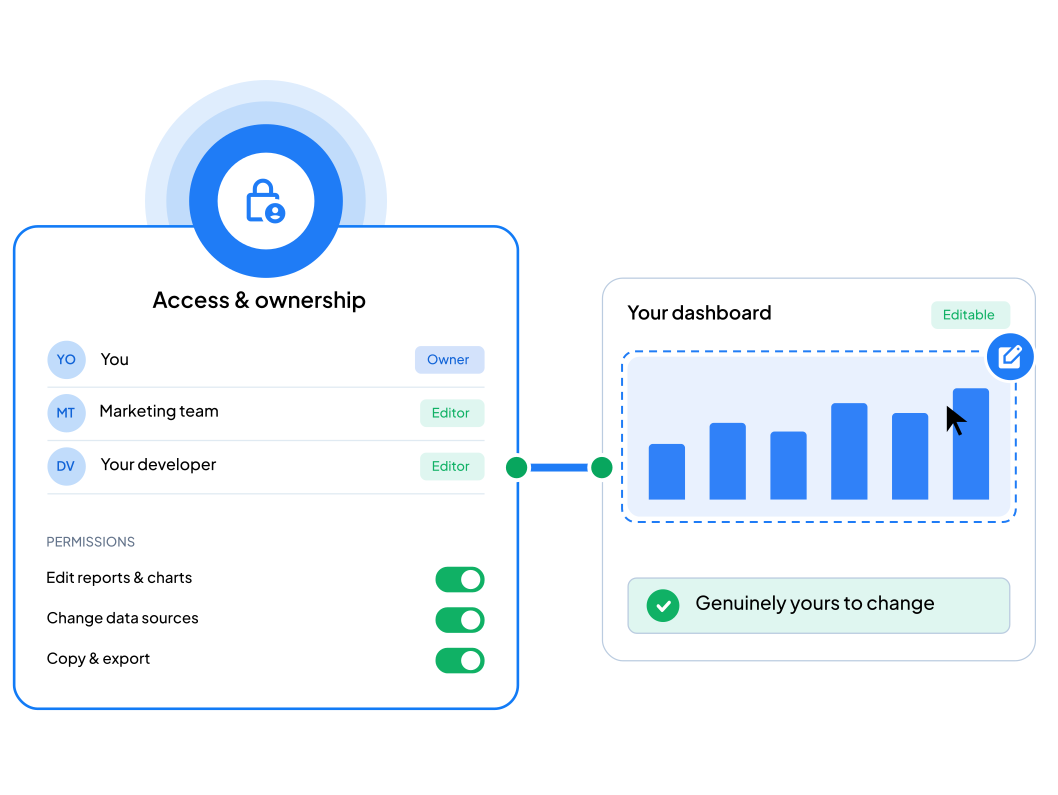
Full edit access transferred to your team
A walkthrough so you can extend it yourself
Controls
Date range selector
Channel and property filters
Segment comparison where it's useful

Dashboard Setup

One-time setup. One dashboard · One analytics property · Up to 5 pages

Order Now - $249

Scope note: Standard scope covers one dashboard, one analytics property, and up to five pages. Additional properties, blended sources, or Ads/CRM data are scoped separately.

Process

How the work runs

Kickoff call

We work out who reads this and what decisions it needs to support. That determines the build more than anything else.

Build

We connect your data and build to that spec: your metrics, your layout, your terminology.

Hand over

We walk your team through it, make final adjustments, and transfer ownership.

Results

What you're left with

A dashboard reading live from your analytics data
Full edit access, so it's genuinely yours
Your core numbers visible without navigating anything
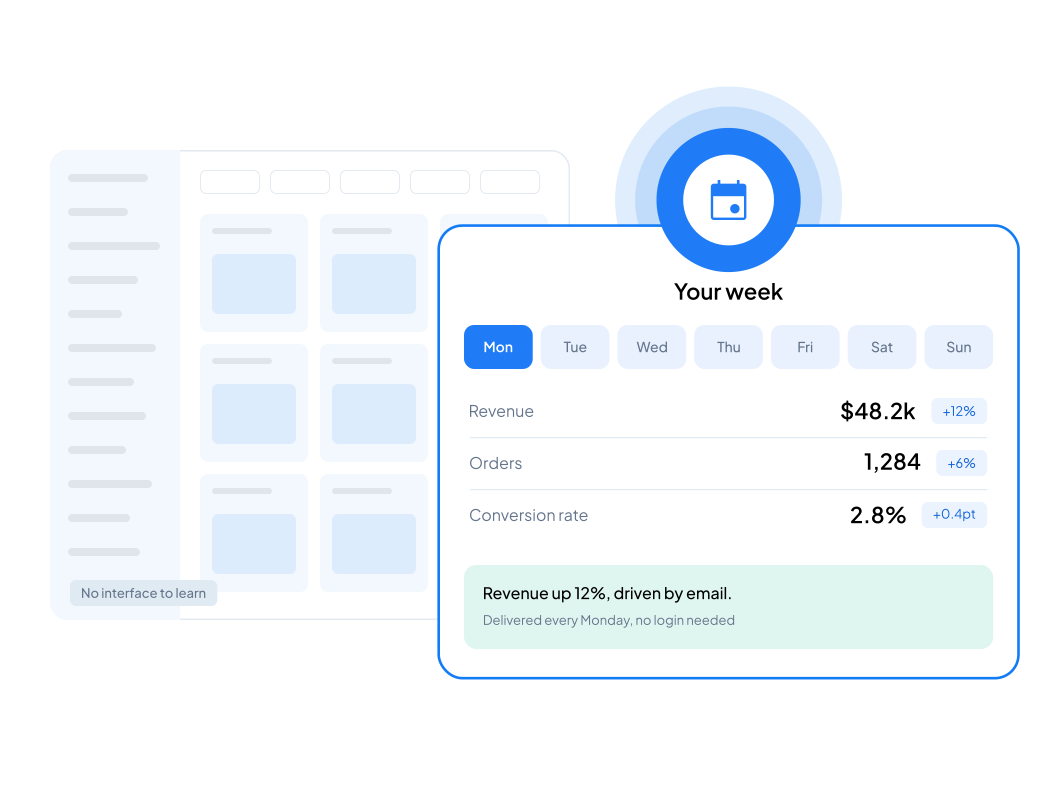
No more Monday morning spreadsheet
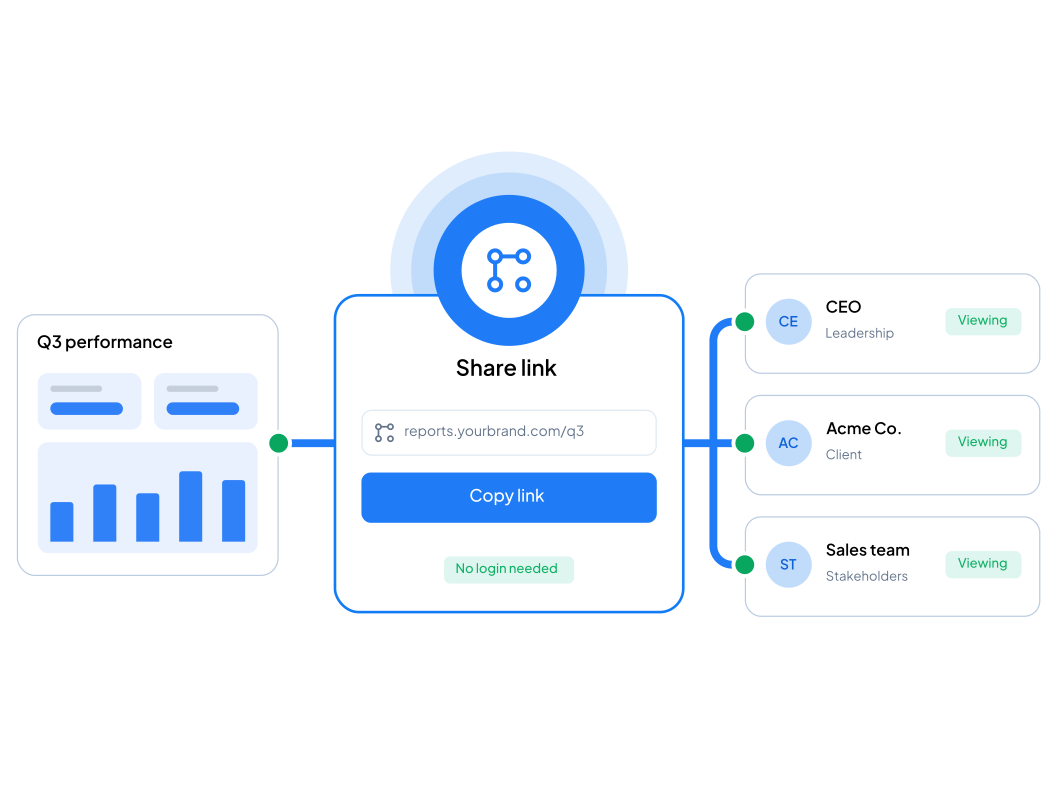
A link you can share with stakeholders or clients

Fit

Who this is for

Teams who need a weekly view without learning the analytics interface
Businesses whose stakeholders want simple over complete
Agencies building client-facing reporting
Anyone still assembling reports by hand

FAQ

Frequently Asked Questions

Does it stay up to date?

Yes. It reads live from your analytics property, so it reflects current data whenever someone opens it. There's nothing to refresh and nothing to re-export.

Can we change it after handover?

It's yours. You get full edit access and a walkthrough covering how to add pages, adjust metrics and change filters, so you're not dependent on us for every tweak.

What if the underlying data is wrong?

Then the dashboard will present wrong numbers with total confidence, which is worse than no dashboard. Run the free audit first. If we find issues feeding the metrics you want to report on, we'll flag them before building anything.

Can this work across several clients?

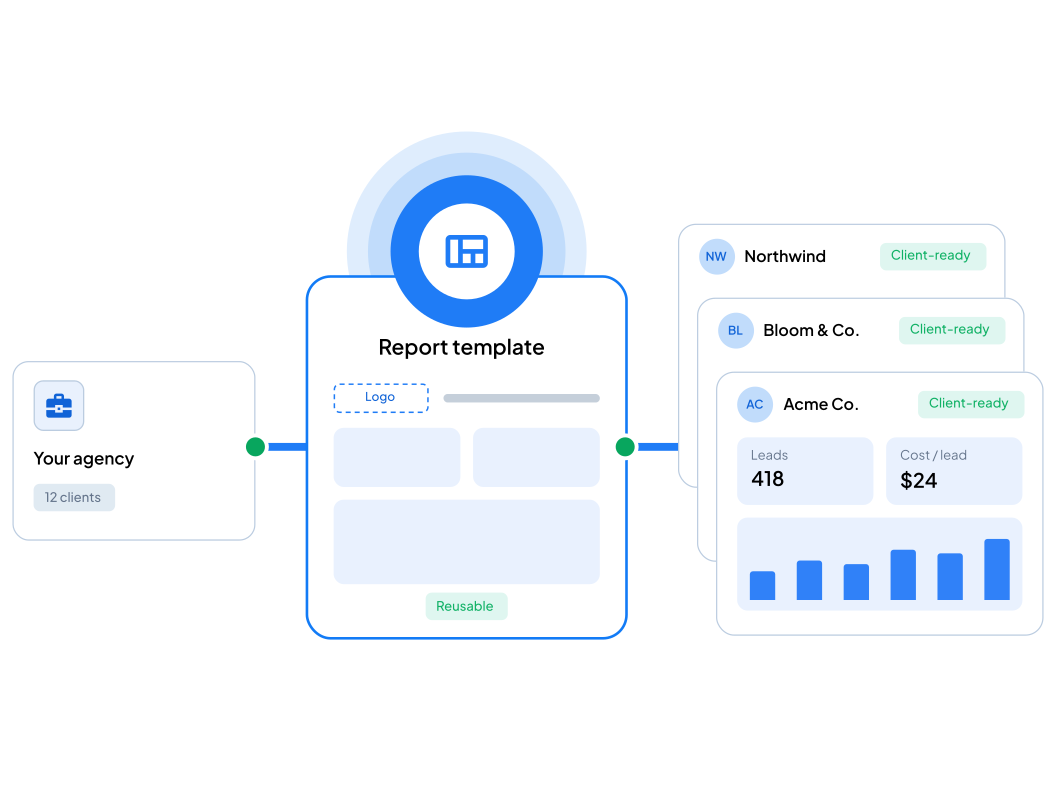
Yes, though it's beyond standard scope. We build a template that can be pointed at each property in turn, which gives agencies consistent reporting without a rebuild each time.