


You have traffic. People are landing on your site, reading your pages, and sometimes adding items to their cart. But conversions are still low, and you are not sure why.
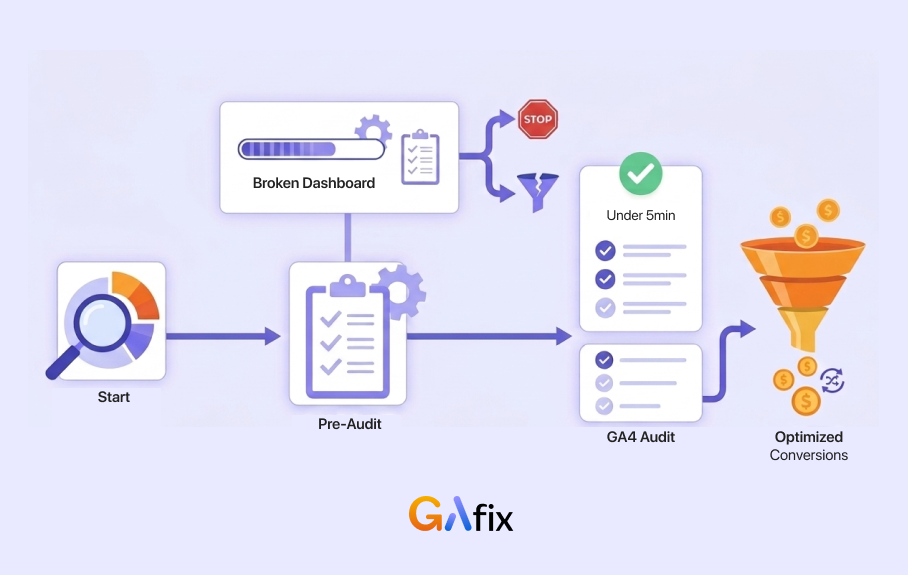
This is where most teams go wrong. As soon as something feels off, they start redesigning pages or running A/B tests. But they do not check if their analytics are even accurate. It is like trying to fix a car with a broken dashboard. You are guessing instead of solving the problem.
This guide shows you a simple, step-by-step way to understand visitor behavior and improve conversions. To turn visitors into customers, you first need to know what is stopping them.
Before you change a single thing, run a free GA4 audit — it takes under 5 minutes and could completely change what you fix first.
Key Takeaways
Before you dive in, here are a few things worth keeping in mind as you work through this guide.
- Most conversion efforts fail not because of poor strategy, but because the data is unreliable. A 2024 VWO study found that 70% of CRO efforts fail due to unvalidated analytics.
- Clean, accurate Google Analytics 4 data is the base for everything. Heatmaps and session recordings only work well if your tracking is set up correctly.
- Tools like GAfix.ai can quickly audit your GA4 setup and find issues like missing events, consent gaps, and broken conversion tracking.
- Small behavior signals matter. Visitors who scroll 75% down a page are twice as likely to convert as those who do not.
- Every insight should lead to action. Rage clicks, form drop-offs, and exit patterns only matter if they help you improve something.
Why Visitor Behavior Analysis Fails Without Clean GA4 Data
Most teams skip this step entirely, and it is the number one reason their optimization efforts go nowhere.
At GAfix, we see the same pattern again and again. Teams spend time tweaking landing pages, rewriting CTAs, or rebuilding checkout flows without checking if Google Analytics 4 is tracking conversions correctly. Our internal data shows that 80% of teams redesign pages before running any kind of tracking audit.
The problem is simple. Bad data leads to bad decisions. That pricing page with a 60% bounce rate? It could just be a tracking bug where your payment gateway misfires and registers fake exits. That low conversion rate on your thank you page? It might not be tracked at all.
A proper GA4 audit checks for the things that quietly break your data without you realizing it.
- Missing or broken conversion events.
- Consent mode issues, which became mandatory in March 2024.
- Duplicate page view events inflating your numbers.
- Inconsistent UTM tracking across campaigns.
In one audit we ran in 2025, we found that 35% of B2B companies had been losing lead data entirely because of iOS privacy changes. None of them knew. So before you change a single word of copy or move a button, run a GA4 audit at GAfix. Everything you learn after that will actually mean something.

Define Clear Conversion Goals and Events in GA4
You cannot improve what you are not measuring. Before anything else, be clear about which actions on your site count as conversions, and make sure Google Analytics 4 is tracking them properly.
Here are some common conversion events depending on the type of business you run.
1. For SaaS companies:
- Free trial started (a 15% conversion rate from landing page views is a solid benchmark)
- Demo request submitted (typically linked to 8 to 12% pipeline growth)
- Onboarding completed
2. For eCommerce:
- Added to cart (10 to 20% of sessions is a healthy range)
- Checkout started (3 to 5% of sessions)
- Purchase completed
3. For B2B:
- Lead form submitted (aim for 2 to 4% from pricing page visits)
- Pricing page viewed (a reliable high intent signal)
- Asset downloaded (useful for nurture campaigns)
And do not stop at the obvious wins. Micro-conversions, the smaller actions visitors take before they convert, are just as important. Tracking things like scroll depth or video plays can tell you a lot about intent. In our own tests, visitors who watched a product explainer video had 40% higher conversion completion rates than those who did not.
Set up both macro and micro-conversion events in GA4. Then use GAfix.ai to make sure they are all firing correctly. A misconfigured event is just as useless as no event at all.
Map Visitor Journeys and Funnels That Actually Reflect Reality
Overall site numbers can only tell you so much. To really understand what is happening, you need to look at website visitor conversion patterns and see the specific paths visitors take, and figure out where things fall apart.
GA4's Funnel Exploration and Path Exploration reports let you do exactly that. Here is a real example of what this can reveal.
A B2B SaaS funnel from Q1 2025:
- Visitor lands on the pricing page
- Clicks the "Book a Demo" CTA
- Views the demo request form
- Submits the form
When we built this funnel, we found a 45% drop-off at step 3, right at the form view. That problem was completely invisible in the aggregate data. When we looked closer, the issue turned out to be mobile friction. The form was just hard to fill out on a phone.
Slicing your funnel data by different dimensions helps you find patterns like this faster.
It is also worth exploring paths you did not expect. We have seen 10 to 15% of sessions visit the careers page right before abandoning their cart. That is a sign those visitors were job seekers, not buyers. Visitors reading support docs before requesting a demo are showing hesitation that better content could address. Running a GAfix audit before you build your funnels also prevents missing events from distorting the picture by as much as 20 to 50%.
Use On-Page Behavior Signals to Find Friction
GA4 is great at telling you what is happening. It can show you which pages have drop-offs and where people leave the funnel. But it cannot show you why. That is where behavior analytics tools like heatmaps and session recordings come in.
Once you know where visitors are falling off, the next step is figuring out what on the page is pushing them away.
1. On landing pages, look for:
- Dead zones where nobody clicks. Around 40% of hero images get zero interaction.
- CTAs sitting below the fold on common screen sizes, where up to 50% of visitors may never see them.
2. On pricing pages, look for:
- Rage clicks on elements that are not actually clickable, which shows up in roughly 15% of sessions.
- Visitors leaving before they scroll far enough to reach testimonials. About 60% abandon around the halfway point.
3. On forms, look for:
- Mobile users giving up before they finish, which is a 40% drop-off on many sites.
- Individual fields causing friction. A phone number field alone can drive a 30% abandonment rate.
When it comes to session recordings, do not just watch them randomly. That is a fast way to waste time. Instead, filter for a specific behavior, like visitors who added something to their cart but did not buy. Watch 50 to 100 of those sessions, and patterns will surface quickly. You might find that 25% of them hit a validation error and rage-clicked their way out, or that a confusing form label kept tripping people up.
The VWO Paltalk case study is a good reference here. A heatmap-driven redesign lifted their conversions by 11.32%. Another team saw checkout completion jump from 11 to 20% after fixing rage click issues on their pricing page.
The key habit to build is cross-checking what behavior tools show you against GA4 event data. When both point to the same problem, you have found something real and worth fixing.
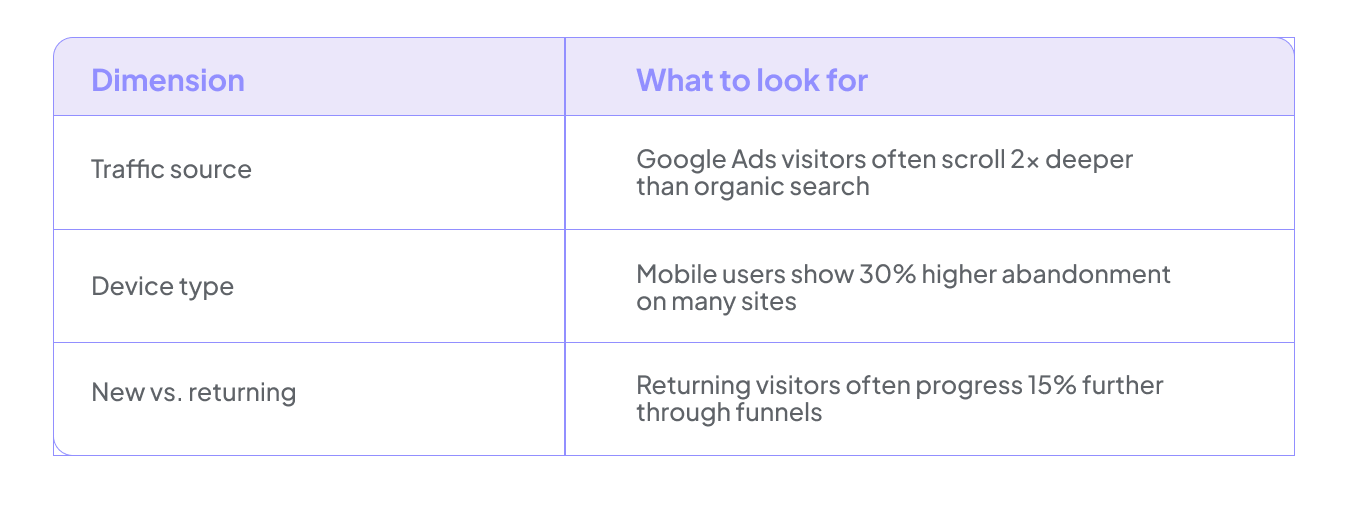
Segment Visitor Behavior for High-Impact Conversion Insights
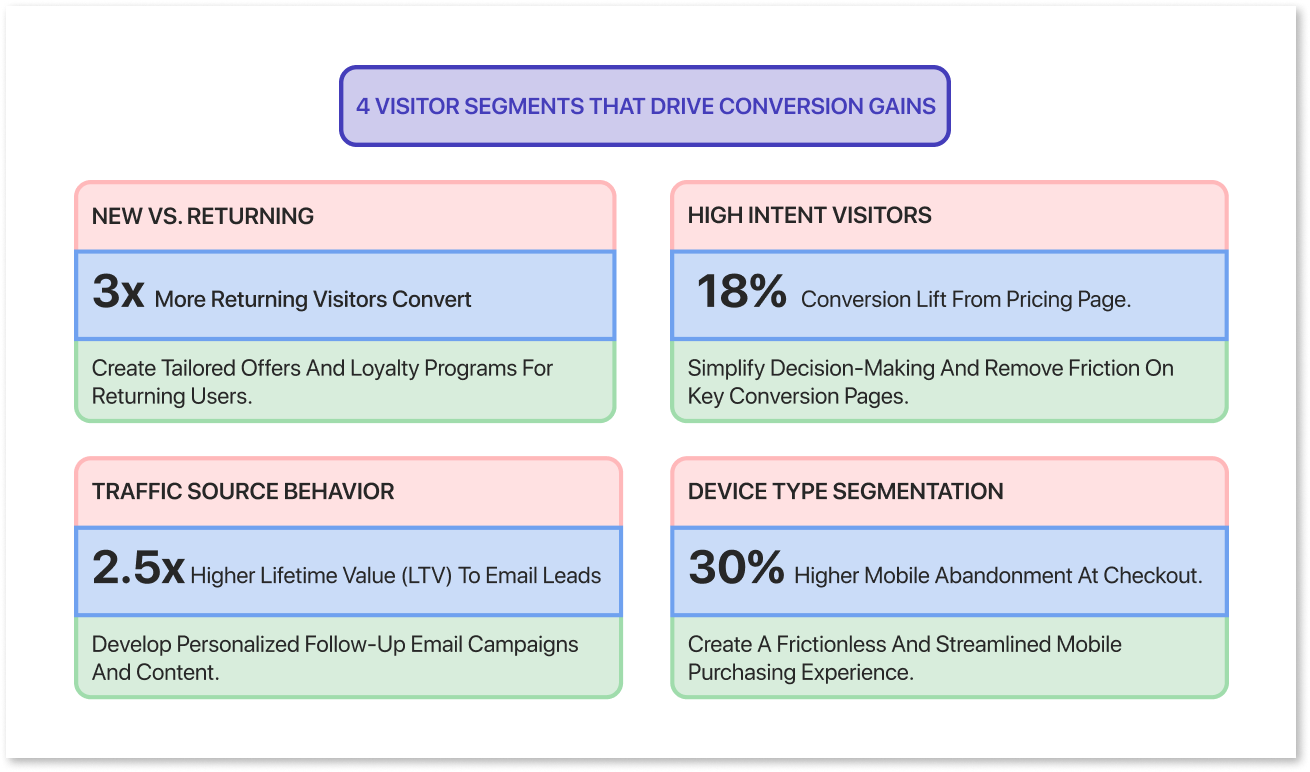
A visitor who bounced in two seconds gets lumped in with someone who spent ten minutes reading your pricing page. That makes everything look mediocre. The real wins come from zooming in on the people who are close to converting but have not quite made it yet.
Here are some of the most useful groups to look at.
- New vs. Returning Visitors: Returning visitors convert three times more on average, so they deserve a different experience than someone seeing your site for the first time.
- High Intent Visitors: Someone who spent more than 30 seconds on your pricing page is not just browsing. They are thinking about it.
- Traffic Source: A visitor from an email campaign behaves very differently from someone who found you through a Google search. Treat them accordingly.
- Device Type: What works on desktop often falls apart on mobile. Looking at these separately can reveal problems you would never spot otherwise.
Here is a real example from February 2025. We identified visitors who spent more than 30 seconds on the pricing page but never started checkout. We showed this group a specific on-site message and followed up with targeted retargeting ads. Conversions from that segment went up by 18%.
The same logic applies to your sales team. If someone keeps coming back to your pricing page, that is a strong signal they are ready to talk. Setting up an automatic alert for your sales team in that situation helped one B2B company improve response rates by 20%.
One thing worth keeping in mind though. All of this only works if your GA4 is tracking things consistently. If your event names are messy or your traffic sources are mislabeled, your segments will be too. A quick audit goes a long way in keeping your data clean and your insights trustworthy.
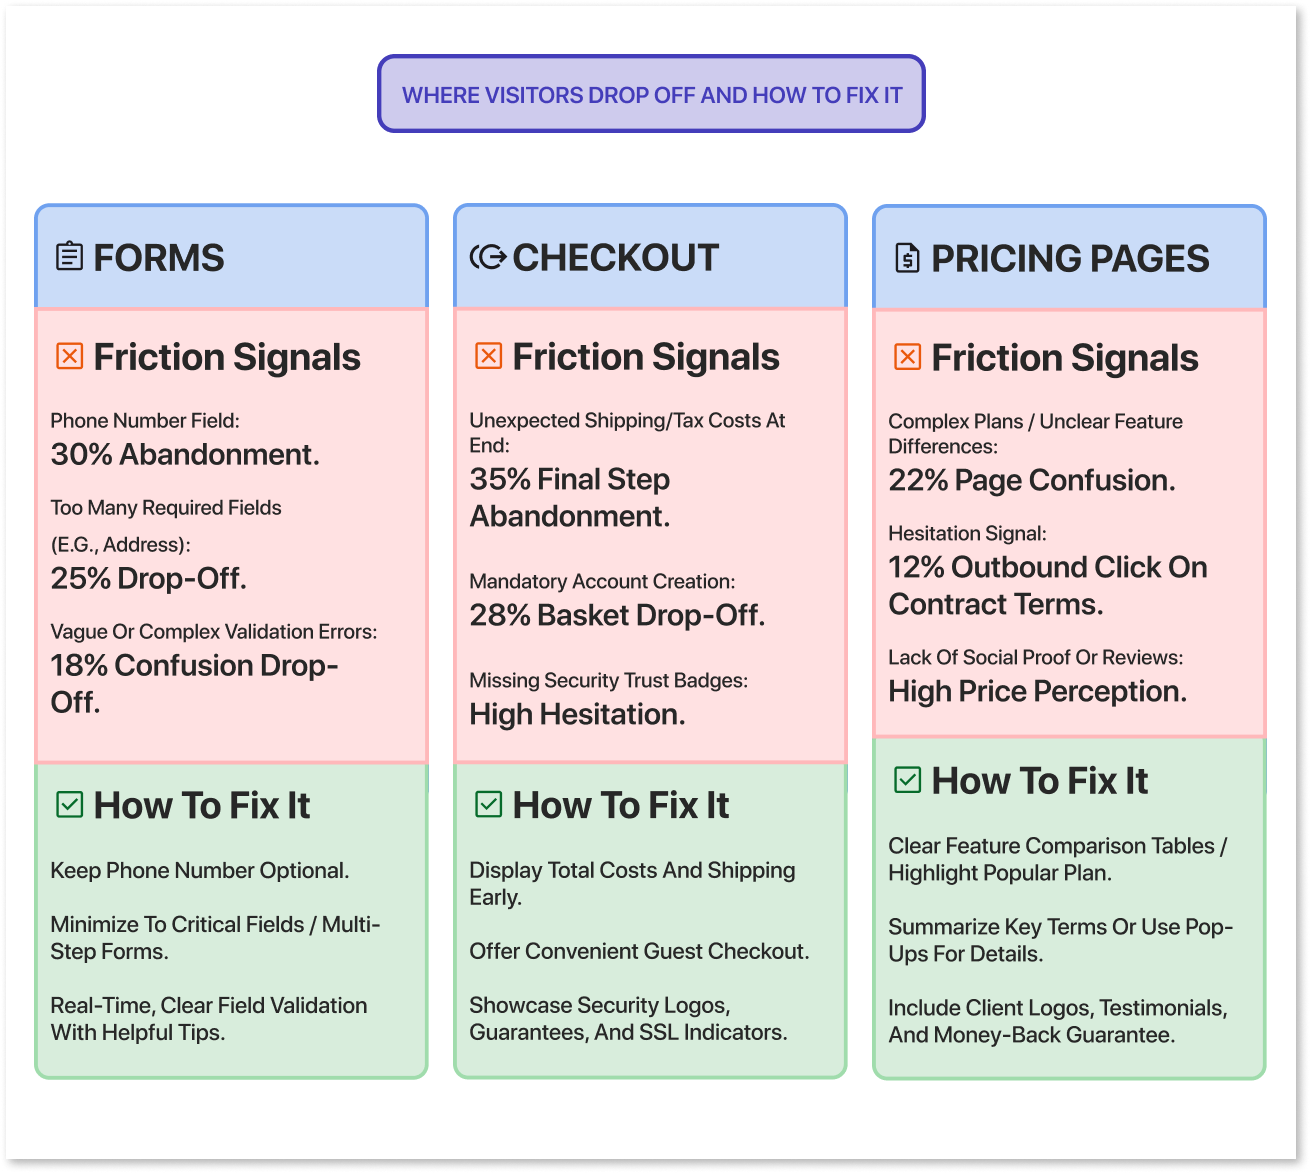
Diagnose Drop-Off on Key Steps: Forms, Checkout, and Pricing
Once you know which segments to focus on, the next step is pinpointing the exact moments where they stop converting. In most cases, the biggest gains come not from overhauling your entire site but from fixing two or three specific friction points.
1. Forms
Start by tracking drop-off at the field level. In one study, a phone number field alone was responsible for a 30% abandonment rate. When the team made it optional and eventually removed it, form completions went up by 743%.
Things to watch for include error messages that keep appearing on certain fields, unusually long completion times which usually signal confusion, and anything that makes the form harder to use on mobile.
2. Checkout flows
Pay attention to how visitors move through your checkout process. A high exit rate on the shipping step usually means unexpected costs or added complexity caught them off guard. If you notice visitors switching shipping options repeatedly, that is a sign they are confused about delivery times. And when someone goes all the way to the payment step but returns to their cart, it often points to trust concerns or a payment failure.
Simple fixes like showing shipping costs earlier in the process or adding trust badges near the payment field can lift checkout completion by around 15%.
3. Pricing pages
Pay close attention to which plans people hover over, whether they scroll far enough to reach the FAQs, and whether they click out to documentation or contract terms. A 12% outbound click rate on contract terms is a hesitation signal. If you are seeing that pattern on your higher-ticket tiers, making the "Contact Sales" option more visible can help.
Whatever you change, track it as a proper experiment with a clear start date and a documented version. That way, when you see a conversion jump three months later, you will know exactly what caused it.
Turn Behavior Insights into Structured Experiments
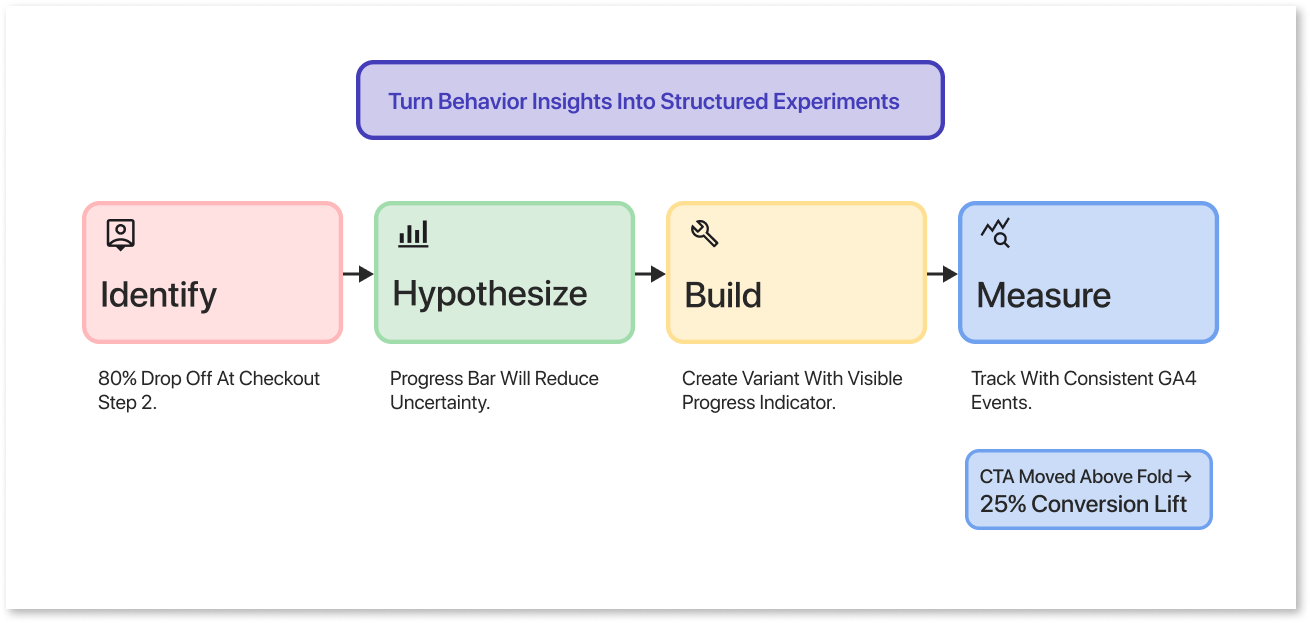
Finding a problem is only half the work. The other half is testing your fix in a way that gives you a clear answer, not just a hopeful page edit that you forget about in two weeks.
Here is a simple workflow you can follow every time.
- Identify the Issue: For example, 80% of visitors drop off between checkout step 1 and step 2.
- Form a Hypothesis: Adding a progress indicator will reduce uncertainty and improve completion rates.
- Build the Variant: Create a version of the page with a visible progress bar.
- Measure: Run the test for a defined period with consistent tracking in place.
A quick real-world example: heatmaps on one site showed that most clicks were landing on secondary links rather than the main CTA, because the CTA was sitting below the fold. Moving it up lifted conversions by 25%.
After each test, log what you changed, when you changed it, and what the result was. Keep this in GA4 as an annotation or in a shared team document. Six months from now, when you see a sudden spike or drop, you will actually know why it happened instead of guessing.
And of course, none of this analysis means much if your GA4 data is not clean. Make a GAfix audit a regular part of your testing cycle.
Build a Continuous Behavior-Driven Optimization Loop
Visitor behavior analysis is not something you do once and tick off a list. It is an ongoing habit that keeps your conversion rates healthy as your site grows and changes over time.
Here is a cadence that works well for most teams. Run a GA4 health check or automated GAfix.ai audit every month to catch issues early. Every quarter, do a deeper dive into your funnels and key segments to spot bigger patterns. And on an ongoing basis, keep running smaller A/B tests fed by your most recent behavior insights.
Start by setting baselines for the journeys that matter most to your business. For example, track the demo request conversion rate from your pricing page, and revisit it after every major campaign or product launch.
It also helps to make this a team effort. When marketing, product, and engineering review GA4 and behavior data together, decisions tend to be sharper and faster. Pick two or three priority issues each cycle and go deep on those rather than spreading attention across a long list of small tweaks.
The whole loop works better when the data underneath it is reliable. Start with a GAfix audit so you are building on a foundation you can actually trust.
Frequently Asked Questions
How often should I audit my GA4 setup?

If you are running campaigns or tests regularly, once a quarter is a good minimum. Any time you change your domain, update forms, or touch your tracking code, run an audit immediately after. Automated tools like GAfix.ai make this easier by running lighter, more frequent checks that catch broken events or missing conversions early. Even sites that feel stable benefit from twice-yearly audits, since small changes to a CMS or tag manager can silently break things without anyone noticing.
How much data do I need before trusting behavior insights?
It depends less on a specific number and more on whether you are seeing consistent patterns over time. As a rough guide, two to four weeks of data and a few hundred conversions on a busy page is usually enough to draw reliable conclusions. For pages with lower traffic, lean on session recordings and usability testing rather than trying to squeeze significance out of a small sample. And none of it matters if the GA4 data itself is messy or incomplete, so always validate that first.
How do I get my team on board with behavior analysis instead of a full redesign?
Lead with a concrete example. Something like "We removed two form fields in May 2025 and conversions went up 23%" lands far better than a presentation about methodology. Start with one or two high-impact journeys, like the path from your pricing page to a demo request, and show a quick win before proposing anything bigger. When your GA4 data is clean and your findings are specific, it becomes a lot harder for people to argue against the data in favor of gut feelings.
Confident Decisions Start with Accurate Tracking
Ensure your GA4 and GTM are correctly configured, reliable, and ready for scale.


Subscribe To Our Newsletter


